Every software product that we use is data-driven. SimilarWeb, SoundCloud, a bunch of Microsoft and Google services, PdfFiller, Readdle, and others you might be using are continually improving their product by using product metrics. If you run a company and would like to deliver a quality product with the most value, encouraging your return and loyalty, you probably start your weeks by looking at metrics – pieces of measurable data that shows the changes in revenue and customer behavior. But how to use them in the most productive way? In this article, we will share our best practices for tracking and improving digital product metrics.
How do we know if our product is successful?
To know if a digital product is successful, we need to have a qualitative or quantitative indicator that reflects a particular characteristic and product success level. Quantitative metrics are easier to track and are used more frequently. Based on these numbers, you can always get an idea about what is happening in general: whether users need such a product, how much they like it, whether it solves their problem.
For example, you have created a Fintech application that can be used for selling and buying cryptocurrency. It seems that the idea is good, people need this product, but still, you don’t have lots of users. How to understand what the problem is? Is there something wrong with the idea, or maybe something’s wrong with the audience or promotion?
Metrics help answer these and other questions. The main thing is to know which one to choose and when to use them. It is not always easy to understand because you can find several answers to any question, and each indicator can be understood in different ways. That’s why we offer you an explanation of the main concepts and terms and show how to choose your product metrics.
How to measure digital metrics?
There is no need to create your own tool for measuring your digital product metrics. All the metrics that are vital for your business success can be counted and analyzed using already existing free or paid online tools.
Some of the tools UppLabs use for measuring products’ performance are:
- Google Analytics
- Matomo
- Woopra
- Mixpanel
- StatCounter
- Hotjar
- Kissmetrics
and others.
Whatever product you aimed to build, UppLabs will help you to choose the best analytic service to track all the important metrics. There are numerous types of integrations we provide within your project development: from APIs to wearable devices that collect and analyze user data.
Metric groups for digital products
metric-groups-for-digital-products
We can divide all metrics into different categories. For example, there are:
- product metrics,
- marketing metrics,
- financial metrics, and
- business metrics.
There are also groups of metrics based on a goal they help to achieve:
- User acquisition metrics
help understand how the users find the product, how many of them use it, and which of them are active.
- MAU, monthly active users
- WAU, weekly active users
- DAU, daily active users
- PCU, peak concurrent users
- CRR, customer retention rate
- CR, churn rate
- Product usage metrics
include all indicators that demonstrate how people use the product and existing scenarios.
- ER, engagement rate
- Number of sessions per user
- Key user actions per session
- Monetization metrics
indicators that make it clear how much you can earn from a product.
- CAC, customer acquisition cost – how much money on average needs to be spent on advertising and promotion to attract one user
- GMV, gross merchandise volume – how much you earn from selling a product
- MRR, monthly recurring revenue
- LTV, lifetime value – how much money the user spends when he uses the product or for a specific selected period
- ARPU, average revenue per user
- ARPPU, the average revenue for one paying user
We will analyze some of the most critical metrics below.
Metrics to predict the business success of a product: CAC, LTV, MRR, ARPU
CAC (Customer Acquisition Cost)
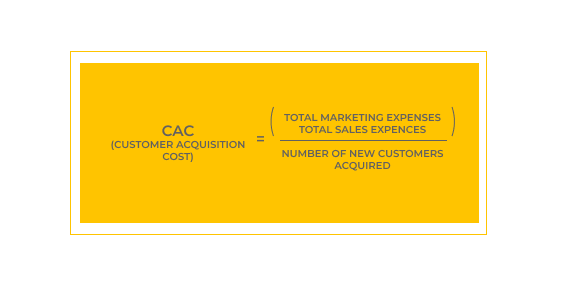
CAC is an essential business metric that establishes the necessary resources to attract new customers and continue its growth. If your goal is to expand the number of your customers and make a profit, then it’s crucial to get the idea of the CAC formula, its significance, and how your team can calculate and use it.
Receiving information about the cost of attracting one customer and using CAC data in different sections will allow you to:
- scale the business;
- improve marketing strategies;
- direct marketing in the right direction: time, money, and efforts;
- increase profits;
- cut costs.
The total marketing expenses that we divide by total sales expenses include:
- all marketing costs of the company to attract new customers (banners, commercials, TV, billboards, and other types of paid advertising);
- salary of the marketing department;
- salaries of all employees involved in the sales and marketing process (for example, wages of employees who spend time on leads consulting, e-mail processing, web-conferences, presentations, social networks, writing articles, creating other content);
- cost of all software related to sales and marketing (platform for e-commerce, CRM, hosting, marketing automation, A/B testing, analytics, support, etc.);
- additional outsourcing professional services used for marketing and sales (copywriters, designers, consultants, content marketing, etc.);
It should be noted that the CAC indicator only has no objective value. It can only work in relation to the LTV (Lifetime Customer Value). Furthermore, it means we need to estimate and analyze the LTV/CAC ratio rather than the specific values of these two metrics.
LTV (Lifetime Value)
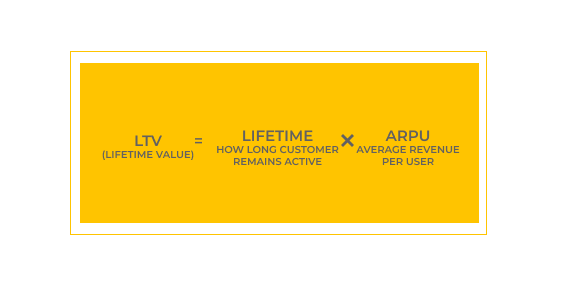
LTV is the total revenue a business can get from a single customer account for the entire life cycle (the whole period of cooperation). In any business model, one of the main goals is to minimize the cost of attracting one CAC client while maximizing the lifetime value of the LTV client.
The Lifetime indicator is a metric that shows how long a customer remains an active user of the product (the cycle from the first to the last service launch).
ARPU is the average revenue per user for a specific period. To calculate it, you need to divide your regular income for a particular period by the number of clients for the same period.
Successful SaaS businesses show that the CAC should be at least three times less than LTV. For example, companies such as Salesforce, SoundCloud, Readdle operate at LTV: CAC ratios in the range of 1: (3-5). While evaluating the startups, even at the initial stage, investors also focus on LTV: CAC = 3.
Based on this data, you can develop an email marketing strategy, prepare more relevant offers, and more efficiently allocate funds for marketing and sales.
MRR (Monthly Recurring Revenue)
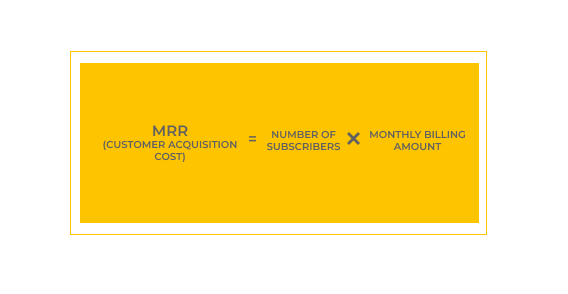
Monthly Recurring Revenue is one of the decision-making metrics used primarily in SaaS subscription models and is converted to months. If you know the projected flow from all new and existing customers and take into account and control the churn of customers. Then it will be possible to predict the cash flow for future periods.
ARPU (Average Revenue Per User)
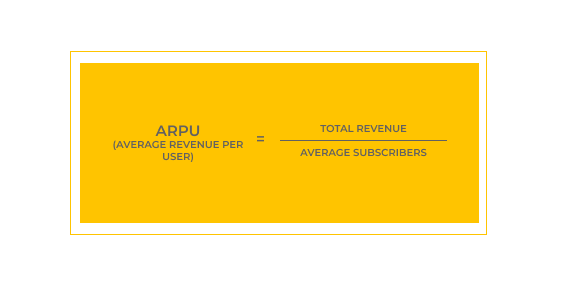
ARPU (Average Revenue Per User) is the average income that you receive from each active user for a specific period. This metric helps companies measure product value, predict profits, and make decisions based on those numbers.
There are no optimal ARPU figures, but there is one rule: if ARPU goes down, you need to attract more customers. You can estimate ARPU only within your business framework or compare it with the result of another company with a similar audience (both in terms of characteristics and numbers).
This metric can’t be measured explicitly because it is highly correlated with the number of customers. For example, two similar products strive for an income of $10,000 per month. Analysts of both services calculated ARPU, and in both cases, it was $15. Only 700 people used Product 1 this month (100 people used the free test period), and the income turned out to be even higher than planned. Product 2 was not doing so well – only 300 clients were recorded (and 100 people on a free plan), the income was $4,500. It turns out that equal ARPU for equal companies with equivalent desired income does not mean the same thing.
Metrics to analyze and grow user engagement. DAU, MAU
New users come to your product every day. Some of them lose interest. Others can save your application for later and then start to use it regularly. One thing is sure; representatives of all these categories check your application every day.
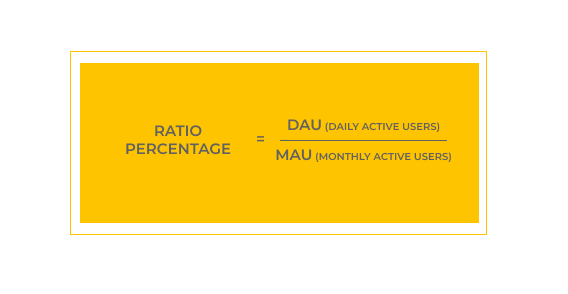
First of all, it’s essential to define your active users. Active users are those who have had at least one session during the analyzed time. These intervals can be different, but we can often research the daily, weekly, and monthly audience.
When you’ve defined ‘Active users’ for your product, the next stage is to determine the number of unique active users in a 24-hr period and the number of unique active users over the past 30 days. With these two metrics, you can divide DAU by MAU to get the ratio percentage.
Active users who are currently using the application is a separate metric that has its name. Most often, these are Users online, but you can also find such abbreviations as CCU (concurrent users) – users who are in the application at a particular moment, and PCCU (peak concurrent users) – the maximum number of users who are simultaneously in the application.
The dynamics of active users can change not only within the framework of the day. It can gradually rise or fall from month to month. And it is quite essential to control it. Segmentation helps to simplify the analysis of changes in the number of active users.
Metrics to keep users interested. CRR, Churn rate
CRR (Customer Retention Rate)
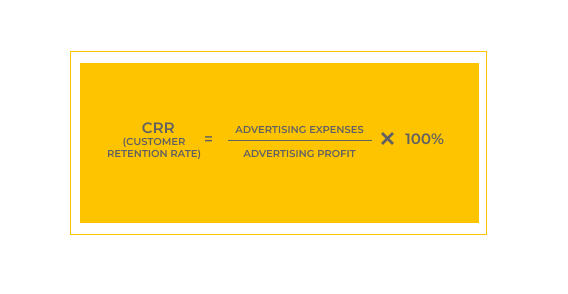
Customer Retention Rate is a measurement of the number of customers that a company continues to do business with over a given time. If the indicator is above average, customers regularly purchase your product, recommend the company as a reliable supplier, etc.
To calculate CRR, define the calculation time interval. Then, subtract the number of new leads from the total number of customers at the end of a particular time. Divide the resulting indicator by the number of leads recorded at the beginning of the measurement interval. Then multiply the result by 100. It is worth noting that the timing of the calculations usually depends on the business.
Correct calculation of CRM in daily business processes will allow:
- to reduce the number of bounces;
- to keep a complete record of sales;
- to obtain comprehensive information about communications with customers;
- to improve the quality of the product through support service.
CR (Churn Rate)
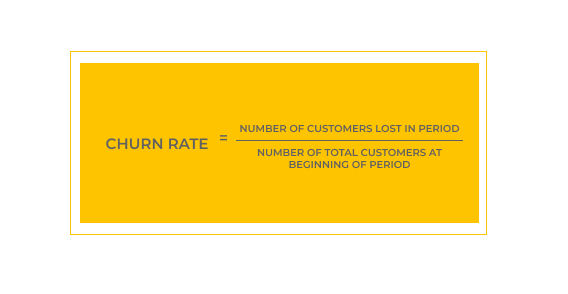
Churn rate is the number of subscribers, clients, or customers who leave your service in a given time. It is useful to calculate this rate independently because if users leave the application and new users do not cover this outflow, the project’s audience will gradually decrease.
In this case, churn is calculated in users – how many of them left the service. And here, it is important to determine which user left – who has been inactive for 7, 14, 30 days, several months, or even a year. This period is selected individually depending on the type of application. Still, it strongly affects the final churn rate: the less the selected user inactivity time, the faster the metric will respond to changes.
For example, at the beginning of the month, there were 200 subscribers, and only 180 of them renewed their subscriptions for the next month. It turns out that the churn rate was 10% ((200-180) / 200 * 100%). However, we don’t count the new users who subscribed this month.
Such churn is usually calculated by months, quarters, or years for applications with a subscription, but this metric can be calculated for any type of application for any period.
Metrics to measure product/feature popularity
The number of Sessions Per User – is the total number of sessions divided by the total number of users. Users are unique visitors. Whenever you have a new visitor on your website, Google Analytics assigns them a unique ID (client ID) that is automatically stored as a cookie in their browsers.
Let’s say you visit the SoundCloud website in Chrome. When you visit the site, Google Analytics adds a cookie with a client ID to your Chrome browser. If you return to the site again later using the same browser, Google Analytics will count you as a returning user.
If you decide to visit the same website for a second time using another browser, you will receive a separate client ID. Therefore, the metric will calculate you like another user.
The number of User Actions Per Session is the total number of user actions divided by the total number of sessions. Google Analytics records a session every single time a user visits your website. One session is when a user loads a page and ends after 30 minutes of inactivity.
One Session is every page view, click, or transaction tracked during this period of activity.
If the same user returns some time later, or the next day, it will be a new session. So, one user can log multiple sessions. It all makes this metric not the best measure for tracking unique website visits.
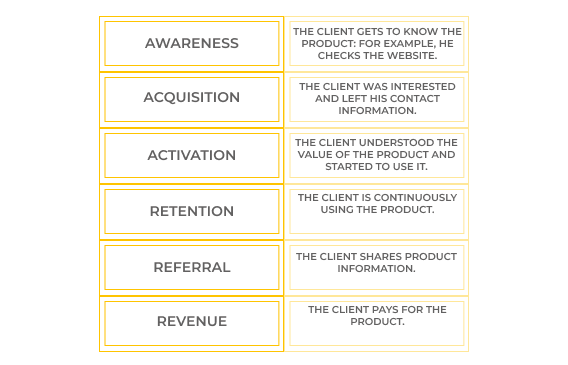
AARRR metrics
AAARRR (also known as Pirate Metrics) is a marketing funnel that describes the main stages of customer interaction with a product. It can be helpful when you need to divide the work with the user into steps and track the indicators. There exist six such stages, if you start with Awareness, or five, if you start with Acquisition (depending on this, there are AAARRR or AARRR abbreviations). This marketing funnel helps to measure the success of customer acquisition and monetization.
Each of these five metrics is critical to startups and businesses. Without tracking these indicators, you can’t achieve sustainability and business growth. AARRR breakdown of Key Performance Indicators (KPIs) helps you prioritize the critical issues and stay on track.
The main advantage of Pirate Metrics is its simplicity. Using them, you can make hypotheses, test them, and immediately see any result. The AARRR model allows you to make quick decisions based on real data coming directly from your customers.
In addition to the fact that these metrics describe your business’s performance, they also become the basis for further optimization. The idea is for you to develop hypotheses, test them, measure the results, and continue to improve your strategy.
How to choose the metrics?
Before choosing metrics, consider what you want to achieve. Metrics should depend on the goals of your business. If you wish to make a profit, attract investments, or gain user loyalty, you will need to choose different metrics.
Before launching a new product try its MVP. UppLabs will help you to validate needed features and collect metrics that will help you to achieve business goals.
It is essential not only which metrics to choose but also how to use the indicators. Two main approaches that we can use in product development:
1. Data-driven approach
First, you get the numbers and then make decisions based on them. The team selects metrics and calculates the indicators. Then, based on the resulting numbers, you understand where to go next.
2. Data-informed approach
Metrics only partially influence your decisions. They can be essential but not the first thing to take into consideration.
There are many options for using metrics: they depend on the product, approach, logic, and marketing strategy. But the general scheme of using metrics:
- we measure quantitative indicators, evaluate (as far as possible) qualitative indicators;
- we try to look at the indicators not separately but in interconnection to see the whole picture;
- we do this at regular intervals to understand the dynamics;
- having received this information, we think about how to use it: either we simply take note, or we decide to change something, experiment;
- we continue to analyze the metrics to understand further what is happening.
How UppLabs can help
Every day UppLabs implements complex and challenging web and mobile projects for Fintech, Healthcare, and Real Estate. We have accumulated extensive experience in subtleties and nuances, which will undoubtedly help improve any project. We try to help the customer realize the best products because its success is our success too.
Our software development agency works end-to-end with the clients discussing all possible scenarios and questions. Starting from strategy to digital, we bring transformational outcomes. It is UppLabs’ task to show you the opportunities, needs, and threats.
Our assurance as a trusted software development service includes:
- Designing and applying appropriate project management standards
- Planning and monitoring the project (timelines and budget)
- Managing project risks
- Ensuring customer satisfaction
- Organizing and motivating a project team
- Creating detailed, comprehensive, and well-structured technical documentation
- Estimating, prioritizing, planning, and coordinating testing activities
- Developing and applying development and testing processes for new and existing products to meet client needs
- Discovery session
- CI/CD (Continuous Integration and Continuous Delivery)
You can always book a call with Upplabs and delegate the task to develop your product. Be sure that we will guide you on needed metrics and provide necessary integrations to collect and analyze them. UppLabs is a perfect companion to lift you Upp!
If you have any questions, UppLabs is always here to help you! We hope to win your business and build a long-term relationship with you!